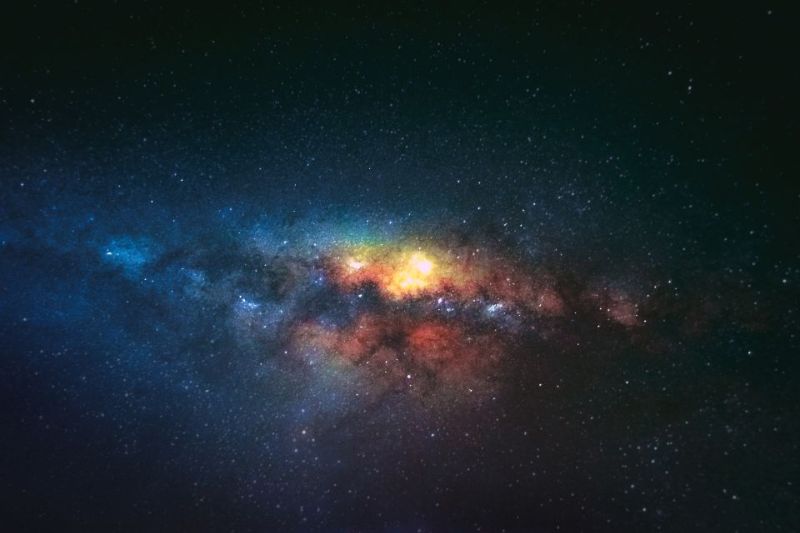
The imposing spectacle of a starry night is almost always overwhelming and provokes a sense of smallness in the face of the vastness of the cosmos and its mysteries. Perhaps that's why humanity originally sought in the stars the explanation of the origin of the universe, the phenomena of nature and even the events that occur in our lives.
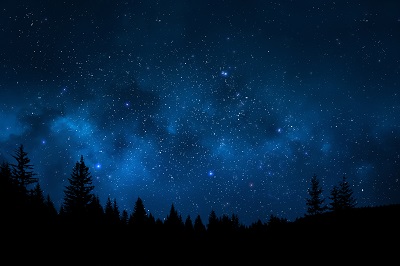
The grouping of the stars in constellations gave sense to their distribution in the celestial vault and, in the eyes of those who studied them, allowed to identify deities or characters that reinforced their view of the nature and the origin of the universe. Thousands of years later, the constellations continue to set the tone for ordering the billions of celestial bodies and many people believe that their bonding with them influences their destiny in a certain way (the zodiac sign is a frequent theme in our daily conversations).
In 2014 a group of researchers at Stanford University decided that it would be interesting to see what the constellations would look like if some of totally objective methods were used to group them , independent of traditions and human imagination. To do this they applied machine learning (ML) techniques, the branch of the Artificial Intelligence (AI) that studies how to discover patterns and relationships in the data that serve to make predictions or make decisions (See the original paper here).
From an astronomical catalogue with all the stars visible to the naked eye they obtained the galactic coordinates and magnitude (measure of luminosity) of each star and applied five ML clustering algorithms in two scenarios: the stars with magnitude smaller than 2.6 (101 stars in 41 constellations) and stars with magnitude less than 4.6 (973 stars in 86 constellations). They then compared the results with the actual constellations and calculated an indicator of the degree of match, known as the adjusted Rand index, ranging from -1 (no ratio) to 1 (total match). If the index is zero, then matches are random.
As shown in the table, four of the five algorithms generated results that have a positive relationship with the actual constellations. This happened both on the scenario of the 41 brightest constellations, and in the 86 that include the least bright stars.
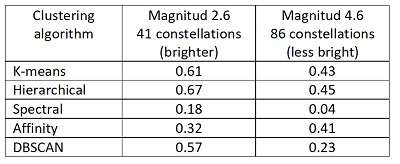
Adjusted Rand index achieved by clustering algorithms for constellation formation
Thus, based only on location and luminosity, these algorithms came to a distribution of constellations similar to that generated historically by observing the sky with the naked eye or with a telescope.
Clustering algorithms are part of ML's unsupervised learning techniques. These techniques find patterns in the attributes of a series of examples that allow them to be grouped into sets of similar characteristics, to assess the degree of similarity between two examples and to gain knowledge from that information (read our article on machine earning).
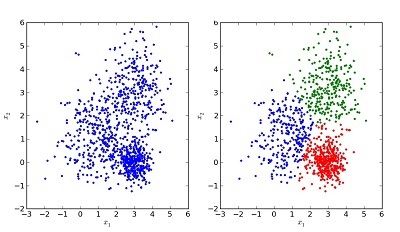
Example of the result of a clustering algorithm
Like all ML techniques, the great advantage of clustering algorithms is that they are as effective at analyzing a small number of attributes from a few examples (location and brightness of 973 stars) as they are to analyze millions of examples with thousands of attributes, although in that case we can no longer draw a graph to see the results.
Clustering is therefore used in applications as diverse as segmenting the population into groups of similar demographic characteristics and purchasing habits to formulate marketing strategies, grouping similar properties for rent to improve the user experience of leasing portals, or segmenting images into blocks to make it easier to identify objects in them.
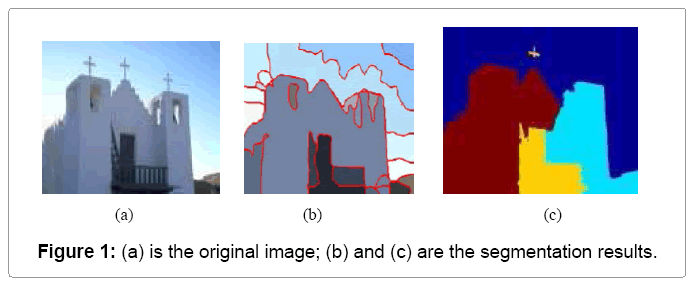
Segmentation of images with clustering. Source: omisconline.org
The five algorithms used by the Stanford researchers to generate
constellations are classic for clustering with ML, so we’ll explain them
briefly:
K-means. This algorithm groups the points based on the distance to the nearest group center (centroid). At first, k centroids are chosen. In each iteration the points are assigned to the group of the nearest centroid, at the end the centroids are recalculated with the average of each of the attributes of the points of their group (location and luminosity in the case of the stars). The process repeats until the clustering in an iteration does not change from the previous one.
Clustering with k-means. Source: http://shabal.in/visuals/kmeans/6.html
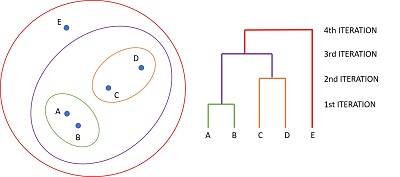
Hierarchical clustering. Algorithm that in each iteration forms larger groups. In the first iteration, the pair of points closest to each other is identified, these points are grouped together, and their centroid is calculated. In the next iteration we find the nearest pair of points again but considering the centroids of the new groups instead of the individual points. The process continues until all the points are in a single group. This algorithm produces a very useful grouping hierarchy for finding complex relationships.
Spectral clustering. Algorithm rooted in graph theory (sets of vertices connected by lines). It works the same way as hierarchical clustering, but instead of using the nearest points as a criterion for forming groups, it uses the points that when joining increase the connections of the network, using an index called modularity. The assumption of some original connection between the points may have influenced it to not have favorable results in the case of stars and constellations, where the connections are imaginary.
Affinity Propagation. This algorithm evaluates simultaneously the suitability of all points to be the central points of others. This is done by calculating the values of four matrix or tables, which have as columns and lines the points to be grouped:
- A "similarity" matrix, each cell s(i,k) contains the distance between the i and k points.
- "Responsibility" matrix, each cell r(i,k) contains the suitability of the k-point to be the center point of point i, compared to the alternative of other points.
- "Availability" matrix, each cell d(i,k) contains the suitability of point k to be the center point of point i, taking into account how suitable it is for other points.
- "Criterion" matrix, each cell c(j,k) is the sum of cells r(j,k) and d(i,k). Cells with higher values are chosen center points, and points that have a common center point are assigned to the same group.
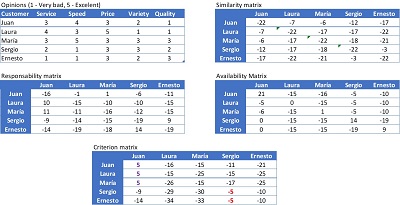
Grouping of customers with affinity propagation
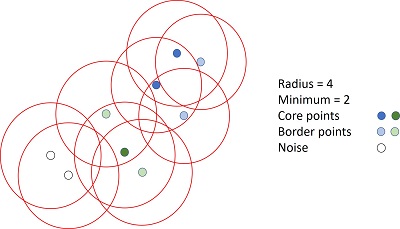
DBSCAN. Despite its complicated name (Density Based Space Clustering of Applications with Noise) the concept is easy to understand. The algorithm identifies groups based on the density of points, that is, how many are to each other. To do this, a reference radius and a minimum number of neighbors are set, and then the points are classified into three types:
Core points, neighboring points at a distance less than the reference radius equal or exceed the minimum.
Border points, they are in the circle of a core point, but their neighbors at a distance less than the reference radius are less than the minimum.
Noise points, they are not neighbors of a core point and their neighbors at a distance less than the reference radius are less than the minimum.
Machine learning clustering algorithms combine human creativity in their creation with the power of computers to help make sense of information that often seems confusing, which serves as the basis for more complex processes and decision-making.
For more information and examples of clustering with ML:
Did you enjoy this post? Read another of our posts here.