Every decision we make in our lives requires making a prediction about the future, which helps us choose the alternative that seems appropriate for the most likely scenario. In this way, a young woman will try to predict whether the boyfriend who proposes her marriage will be a good husband before responding, a bank will grant a credit based on their prediction of whether the person requesting it will pay off her debt, and a company will launch a new product if they believe it will be well accepted by their customers.
When a decision is sporadic, we spend a significant amount of time getting information to make a forecast, because there is not much previous experience. However, when a decision is repeated continuously, over time we establish criteria that facilitate the decision based on the result of previous experiences. In an organization these criteria are converted into business rules that must be followed by those in charge of making these decisions.
Business rules usually relate certain circumstances to a result. For example, a bank's experience may indicate that historically clients with stable employment and savings pay their debts, so the rule will establish that a credit may be authorized if the applicant has stable employment and savings, because it is very likely pay for it.
The automation of such decisions is one of the areas of Artificial Intelligence (AI) with the highest growth today and its development is a matter of debate, both because of the type of decisions that begin to be automated (with high impact on the life of people and in areas considered intellectual work), as because its use reveals aspects of the decision process that are not analyzed much when the decision is made by a person (read our article on the subject here).

Predicting a result from certain circumstances falls into the field of Machine Learning (ML) classification problems, a branch of AI that studies techniques for discovering patterns and relationships in data.
If we are looking to know if a solicitant will pay a credit based on his history, whether a boyfriend will turn out to be a good husband, or predict whether a product will succeed in the market, what we want is to assign a category label to each case. In the first one we want to know if the attributes of the applicant for a credit correspond to the category of paying customer or non-payer, in the second whether the groom will be of the husband category good or bad, and in the third if the answer is of the category yes or no.
In these examples the categories in which a case can be classified are only two (payer or non-payer, good or bad, yes or no), which are represented by 0 and 1 or by a number between 0 and 1 indicating the probability that it is one category or another. However, classification techniques can be used to assign multiple categories.
To assign a label, classification techniques use mathematical formulas and algorithms to make a process that in simple situations we easily do visually with the help of graphs, in which we represent the value of the attributes or characteristics of each of the examples, as well as the category to which each example belongs.
The graphs below represent three fictitious sets of a bank customers. Each point represents a customer and the location of the point depends on the value of two attributes, annual income on the horizontal axis, and savings balance on the vertical axis. The color of each point represents the category, orange if the client paid his credit, blue if he didn't pay for it, and green if he paid it late.
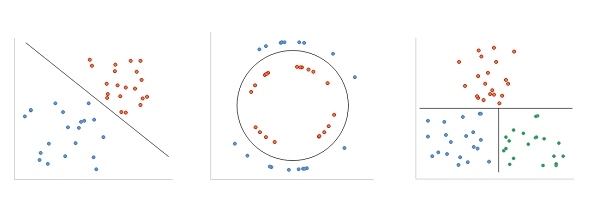
These graphs clearly distinguish the regions created by the categories, so we can draw lines as borders between them. To determine whether a person can be expected to pay for her credit, we identify the category of the region where the point defined by her annual income and the balance of her savings falls in.
Based on the attribute values and category label of a large set of examples, ML classification techniques calculate border line formulas or criteria for assigning the category value to new cases, under the assumption that attribute similarity implies that they correspond to the same category.
Below, we briefly describe the main classification techniques that exist, which, while they can be applied to any number of attributes and categories, have different performances depending on the type of problem and the degree of complexity.
Logistic regression. It finds the border line formula that, for each point, maximizes the probability that the category is the one assigned on the label. It works for any number of attributes in problems of two categories that can be separated by a straight line.
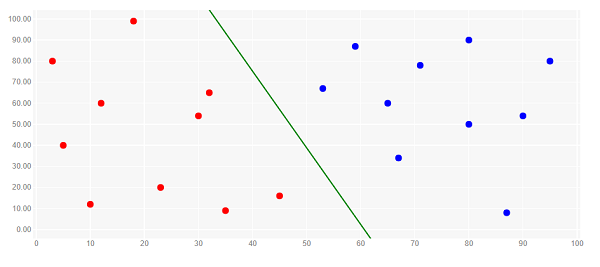
Image originally puslished here
Vector support machines. It finds the optimal border line formula, the one
with the greater distance between it and the nearest points, in order to reduce
classification errors. Like logistic regression, it applies in cases of two
categories that can be separated by a straight line.
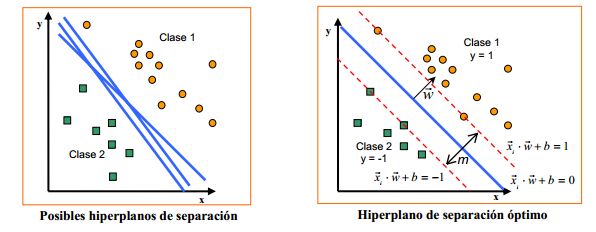 Image originally published here
Bayesian classifier. Probabilistic technique based on Bayes'
conditional probability theorem. It finds the border lines that
maximize the probability that the category of a point is the one that was
labeled, given the probability that the point is the one analyzed. Widely used
in various areas, its effectiveness depends on the fulfillment of the model
assumptions.
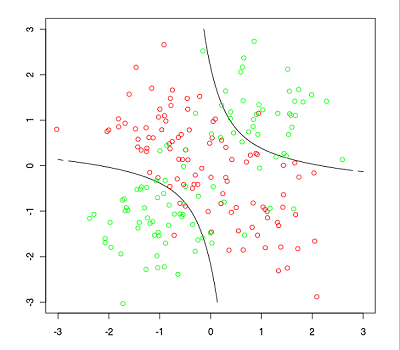
Image originally published here
Decision trees. A technique that generates straight border lines
for each of the attributes, according to a criterion that measures how much the
points are separated. These lines and their intersections form the regions that
fit the labeled categories. They are called decision trees because borders can
be used as questions to decide the category of a point.
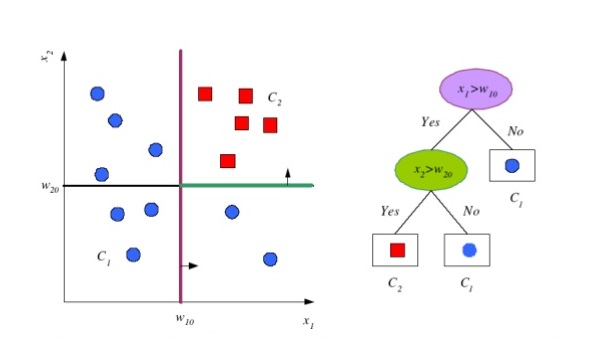
Image originally published here
K-neighbors. This technique assigns each point the label of
the category to which the majority of its nearest k neighbors belong,
the resulting border lines are curves. It is applicable for any number of
categories and attributes, as well as multiple border lines.
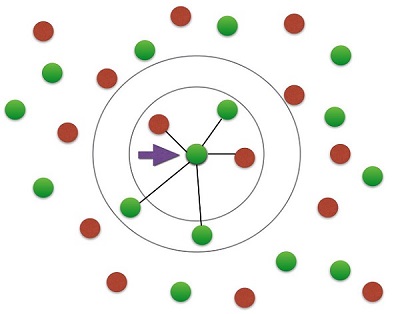
Image originally published here
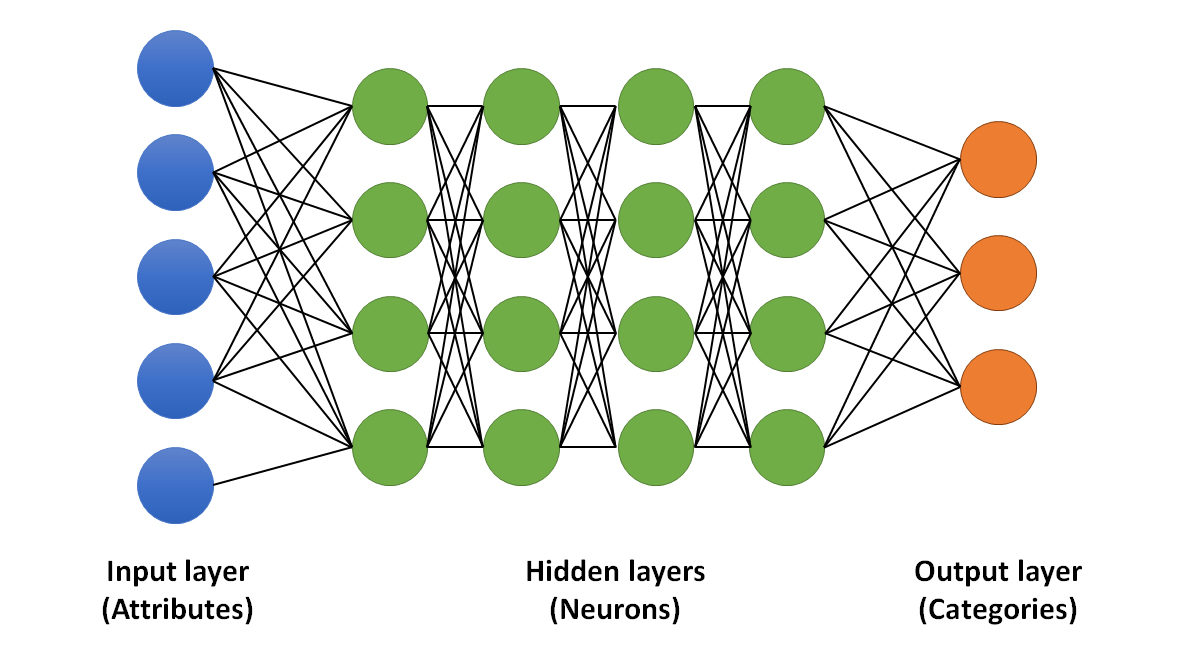
Neural networks. It is the most modern of classification techniques, it uses networks of hundreds or thousands of linear classifiers called neurons, with which it performs the classification of very complex problems (read our article on how they work here).
There are various methodologies to increase accuracy and overcome the constraints of these classification techniques, such as using multiple classifiers and combining their results, transforming the data to be linearly separable and, of course, new types of neural networks, so this is one of the most interesting and wide areas of AI.
Did you enjoy this post? Read another of our posts here.