Clustering with Artificial Intelligence and Human Development Indexes
Contributing to the search for solutions to the world's social and environmental challenges is one of the most important applications of Artificial Intelligence (AI) and Machine Learning (ML). It gives a humanistic sense to the technological effort, expands the perspective beyond the search for profits and improves the image in the face of public opinion. That is why major companies and research centers have implemented numerous projects to support the work of institutions and governments.
A few months ago McKinsey published a study, which concludes that the use of AI and data science has a major potential impact in areas such as education, health, living standards, equal opportunities, environmental sustainability and job security. This is specially to ensure that public policy support reaches the people who need it most.
To exemplify how ML techniques can be used to generate information that serves as a basis for discussing public policy-making, we did a rapid analysis of data from the Municipal Human Development Report 2015, published by the United Nations Development Program.
The document presents the Human Development Index (HDI) of 2,457 municipalities in Mexico. The HDI has three components, valuated on a scale of 0 to 1:
- Education, measured with years of schooling and years of expected schooling
- Health, measured with life expectancy at birth
- Income, measured with gross domestic product per person
The document reports that the average HDI 2015 of municipalities is 0.759, higher than the average of 0.737 obtained in 2010. The distribution of municipalities is:
Human Development Level |
Municipalities |
|
Very high (IDH 0.8 or higher) |
102 |
|
High (IDH between 0.7 and 0.799) |
796 |
|
Medium (IDH between (0.55 and 0.699) |
1,417 |
|
Low (IDH less than 0.55) |
142 |
|
Total |
2,457 |
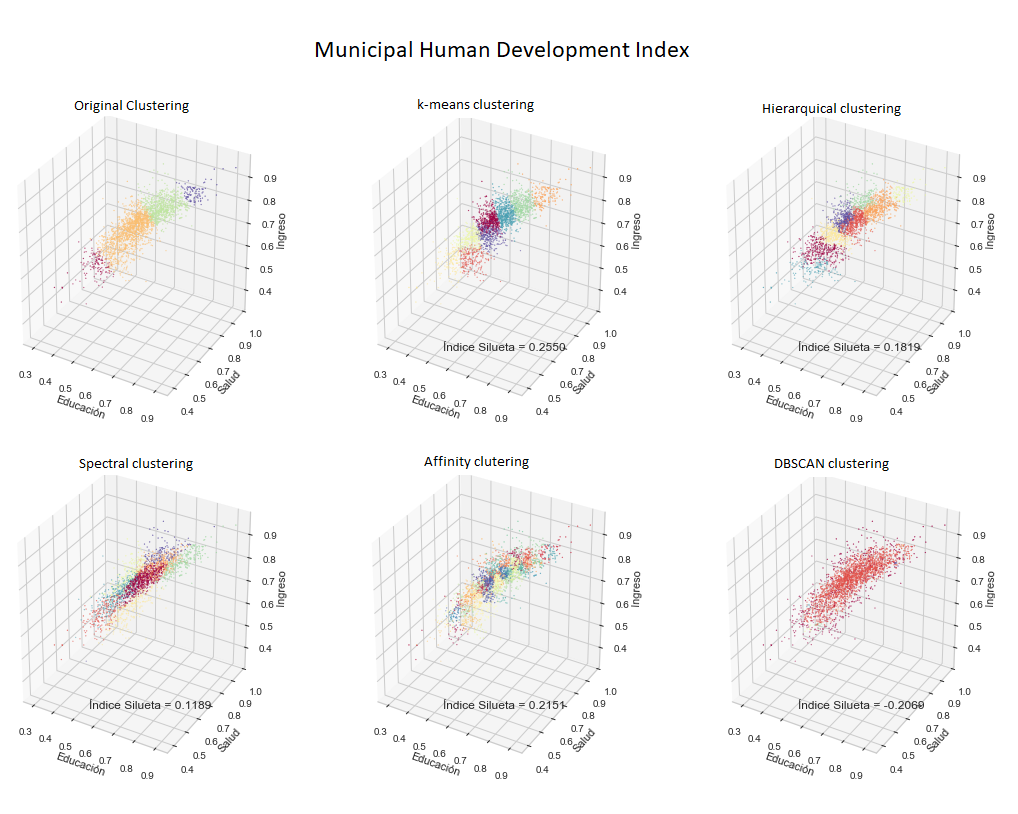
To find out, we applied some of the main clustering ML techniques to the points defined by the components of education, health and income of the HDI of each municipality (see our article on clustering to learn how these techniques work).
The graphs below show the points with the original clustering (human development level), as well as the result of the five clustering techniques used. In each case the value of the so-called silhouette index is presented, which has a maximum value of one. This index measures how well grouped the points are based on the relationship between the distance of each point to the others in its group and the distance to the points in the nearest group. The best result was the K-means technique, which yielded a silhouette index of 0.2550.
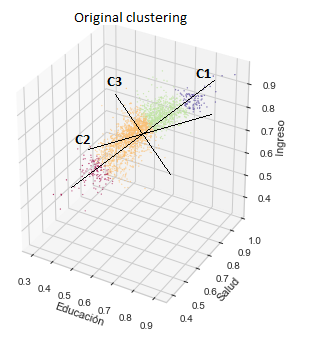
To find a representation that better explains the variability of the data, and reduces the number of variables to handle, there is a technique called Principal Component Analysis (PCA). Applied to the case under study, the PCA shed new axes called components. The following graph shows the original clustering with the resulting axes of the PCA, the first (C1) explains 85.9% of the variations, the second (C2) 8.5% and the third (C3) 5.6%.
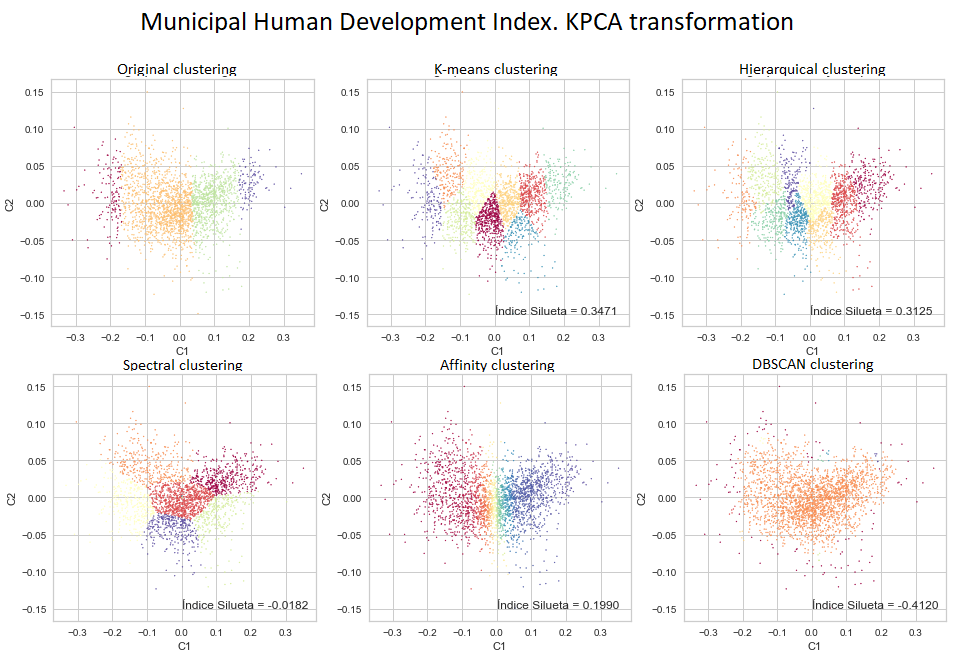
There is a variant of this technique that yields good results in some conditions and is called Kernel Principal Component Analysis (KPCA). This variant was the one that yielded the best results in our case.
As the first two components explain most of the variations, we reapplied the clustering techniques, but now to the points defined only by the value of the two main components. In addition to allowing a clearer representation in two dimensions, the exercise gave a better result, the k-means technique again obtained the highest silhouette index with 0.3471, value greater than 0.2550 obtained without making the KPCA transformation.
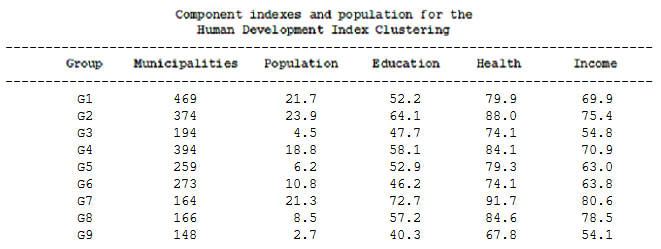
 The table below shows the number of municipalities, the population in
millions (according to the 2015 INEGI intercensal survey), as well as the
average value of HDI components for the nine groups identified by the K-means clustering
with KPCA transformation.
Three points are noteworthy in this clustering:
- The municipalities of group 9 show the lowest level of development in all components.
- In group 3 there are municipalities with also low income, but with health and education indexes higher than group 9. Why isn't that difference reflected in income? Group 6 has health and education levels similar to group 3 but has a higher income.
- Group 8 municipalities have a high level of income and very high in health, but not so in education, what does this mean in terms of equity?
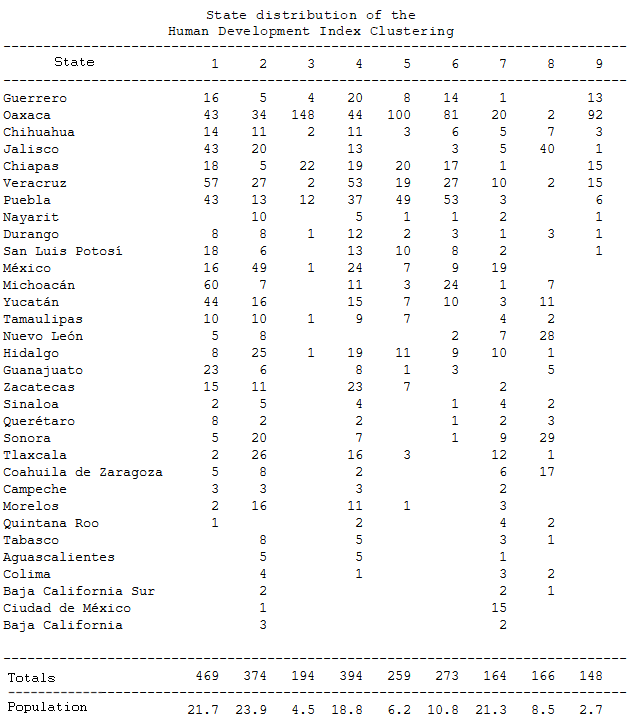
The following table shows the distribution of groups by state. The municipalities of group 9 are mostly in Oaxaca, Veracruz, Chiapas and Guerrero. The municipalities of group 3 are mainly in Oaxaca and Chiapas, so an analysis of these two states can be illustrative. Finally, the municipalities of group 8 are in Jalisco, Sonora, Nuevo León, Coahuila and Yucatan.
Surely development specialists will be able to answer some of these questions, as well as obtain other useful conclusions to support the discussion of programs to address specific areas or conditions. The important thing about this exercise is that it shows how AI and ML tools can represent an opportunity for government agencies such as the Mexican Welfare Secretariat, or organizations such as the UN, to have relatively easy access to better elements of information to carry out their activity.
Companies and institutions engaged in the development of artificial intelligence and machine learning tools have a responsibility to also use their technology for the common good, to this day they show readiness to do so with advanced image and facial recognition, natural language processing, as well as data analysis, for medical, financial or agricultural services, as well as environmental studies. It is worthwhile to explore opportunities for collaboration for the benefit of the whole of society.
Did you enjoy this post? Read another of our posts here.

